About PlantGSAD
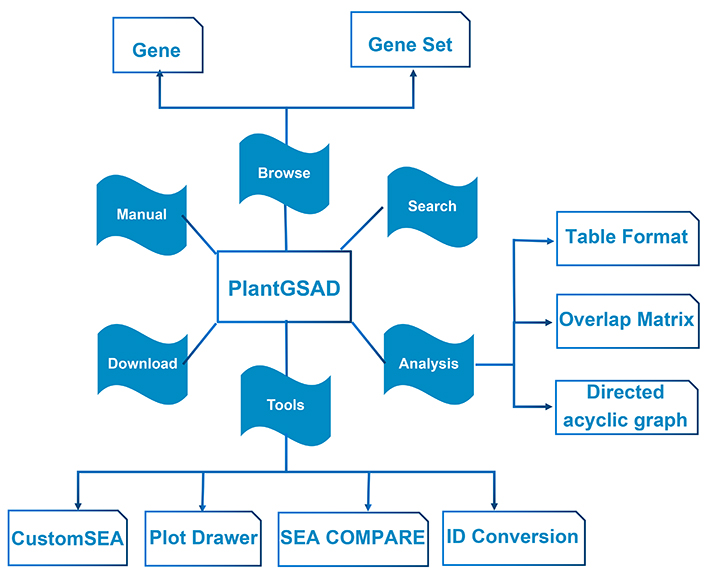
We present here a comprehensive platform of plant gene set analysis. Below is the design structure of the PlantGSAD database.
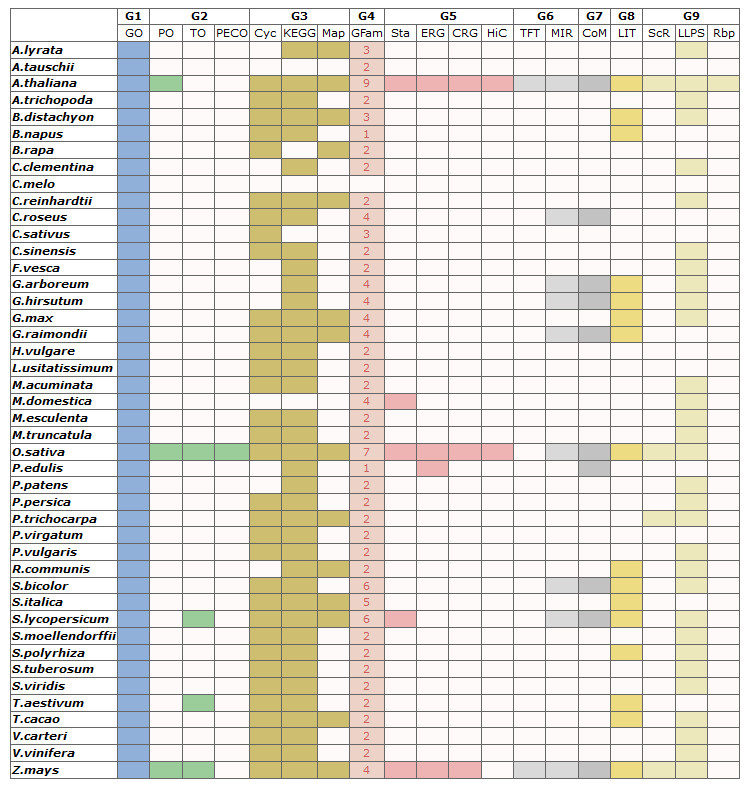
The category information of total 236,007 gene set in 44 species
Note:
(1)Color not in white means background database is available, while white means under construction.
(2)The numbers in column are available gene set.
(1)Color not in white means background database is available, while white means under construction.
(2)The numbers in column are available gene set.
How to do Gene set enrichment analysis (GSEA)
It is necessary to prepare the gene list of organisms that PlantGSAD supported. If PlantGSAD did not support that organism, maybe the tool of Custom SEA can offer the enrichment analysis. Furthermore, if you have more than one gene list, please try the same following procedure again and the SEA results might cross compared through the tool of SEA Compare.
Please click the "ANALYSIS" button in the navigation bar to start your GSEA analysis.
1.What data PlantGSAD contains for GSEA analysis?
Raw gene set annotation data is generated through some databases covering agriGOv2 (GO gene sets), Phytozome (GO and KEGG gene sets), Planteome (TO, PO, PECO gene sets), MapMan (MapMan gene sets), PlantCyc (plantCyc gene sets), TAIR (gene family gene sets), PlantTFDBv4.0 (TR gene sets), iUUCDv2.0 (Ub gene sets), PlantEAR (EAR gene sets), PCSD (chromatin states related gene sets), ChromDB (chromatin associated factor related gene sets), DrLLPS (LLPS gene sets) and so on. Moreover, gene sets from one species may be from its functional database, such as maize (MCENet), cotton (ccNET) and sorghum (SorghumFDB). Finally, published references also are main source of data sets, like literature gene sets, single cell RNA-seq gene sets and RNA binding protein gene sets.
2.Which statistics method should I choose in the analysis page of PlantGSAD?
When the input list is compared with the previously computed background, or is a subset of reference list, choose hypergeometric or fisher, for latter only when your query number is quite small. When the input list has few or no intersections with the reference list, the Chi‐square tests are more appropriate.
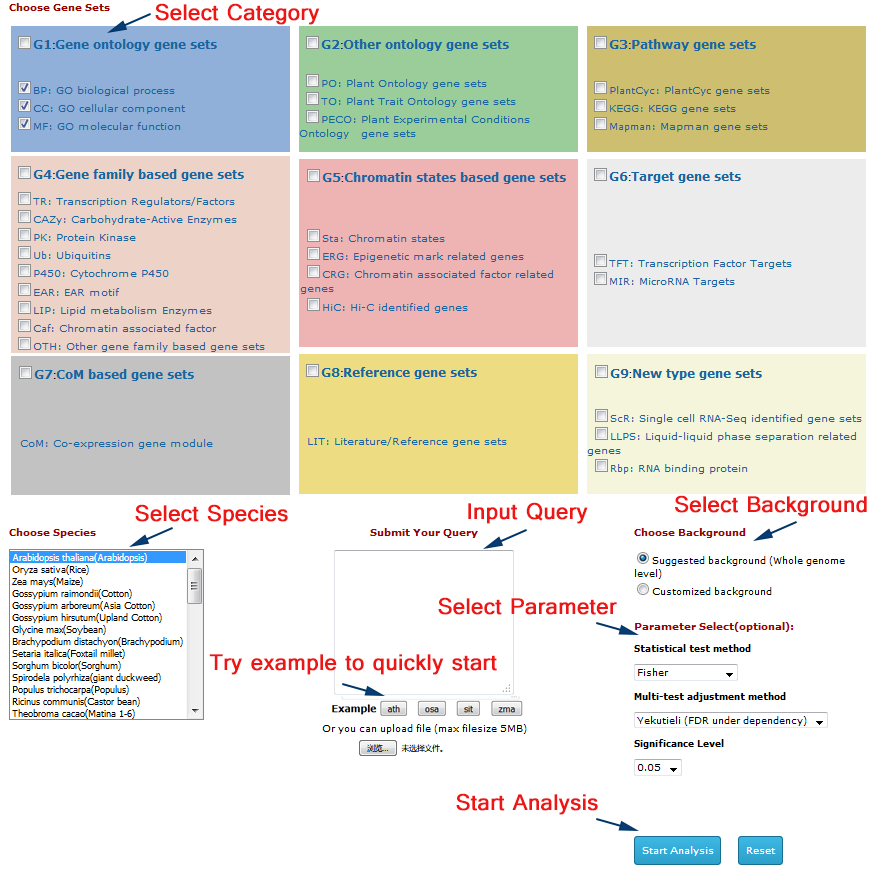
3.Quick start to use our website
First, you should make sure that the species you studyed has been included in the suppored organisms of PlantGSAD.
Then you must choose this species following the tips in the picture below. Next, you can select categories of gene sets
which you are interested in. In the query box, you should submit either gene locus ID or affymetrix probeset ID.
On the bottom are other parameters including statistical method and cutoff. After doing so, click “Start Analysis” to conduct this GSEA analysis.
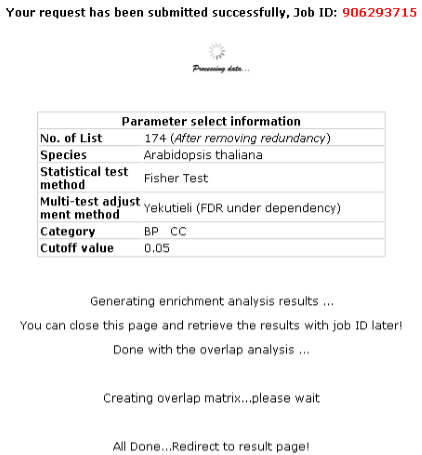
2nd step: Start computing overlap
You will get your job ID while the website is running program, which you can retrieve result
even several weeks later.
How to use Tools
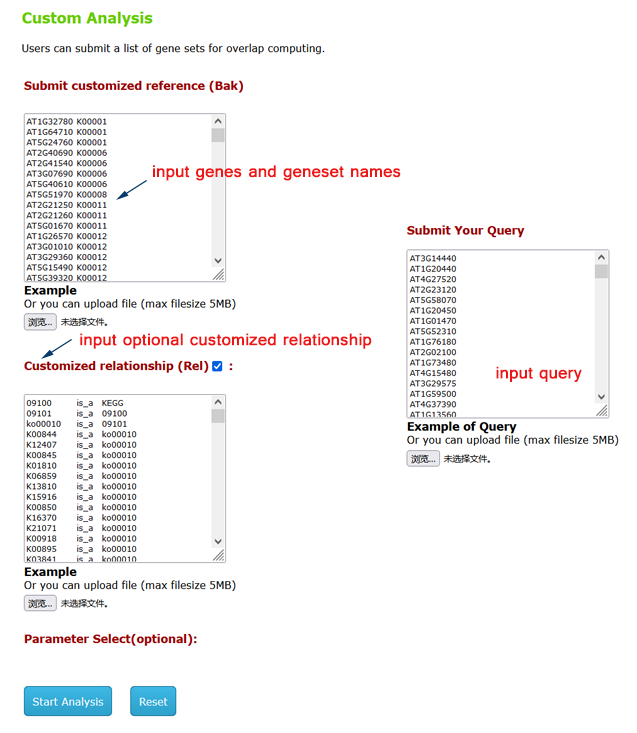
1.Custom SEA
custom SEA analysis tools were personalized to the needs of the individual user-defined data ranged from specific plant,
animal or other organism, which provided for flexible strategy based on customized background (corresponding "customized reference (Bak)" in the picture below, this
is necessary to submit for computing) and optional relationship of terms (corresponding "Customized relationship (Rel)" in the picture below, this
is optional to submit for computing). If users provided the input list and customized background, they would get their interested GSEA analysis results.
On this basis, the DAG graph determining the relation between terms would be established if the reference file of relationship of terms was provided.
1st : Choose Parameters of Your Analysis
You can submit a list of gene sets for computing. Meanwhile, you must submit the customized reference (Bak).
You can submit a list of gene sets for computing. Meanwhile, you must submit the customized reference (Bak).
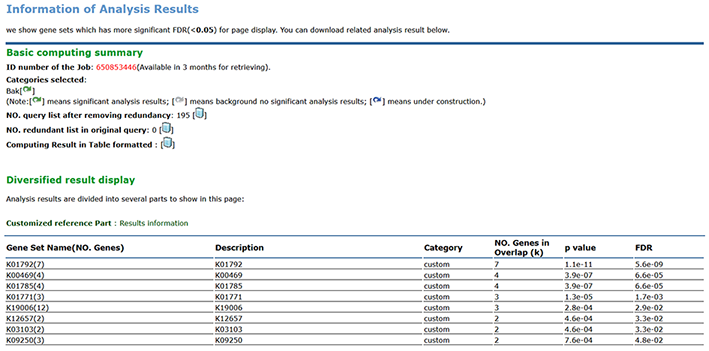
2nd : You can check out the result on page.
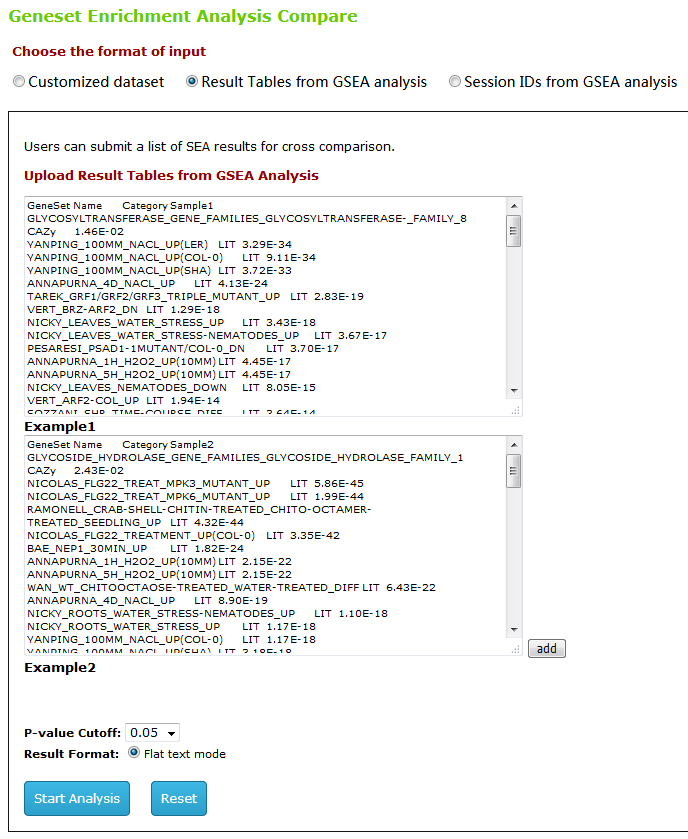
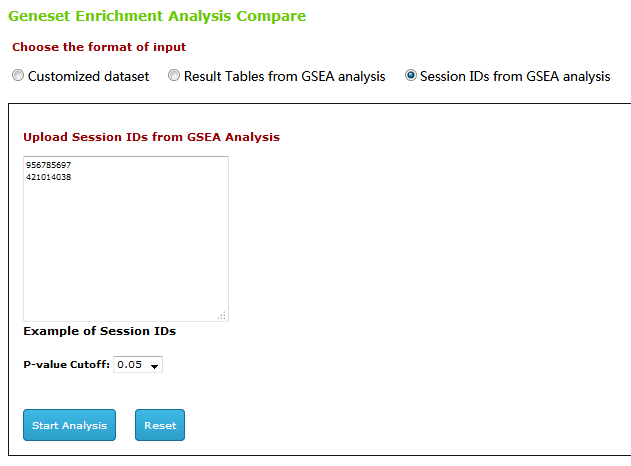
2.SEA Compare
Type1
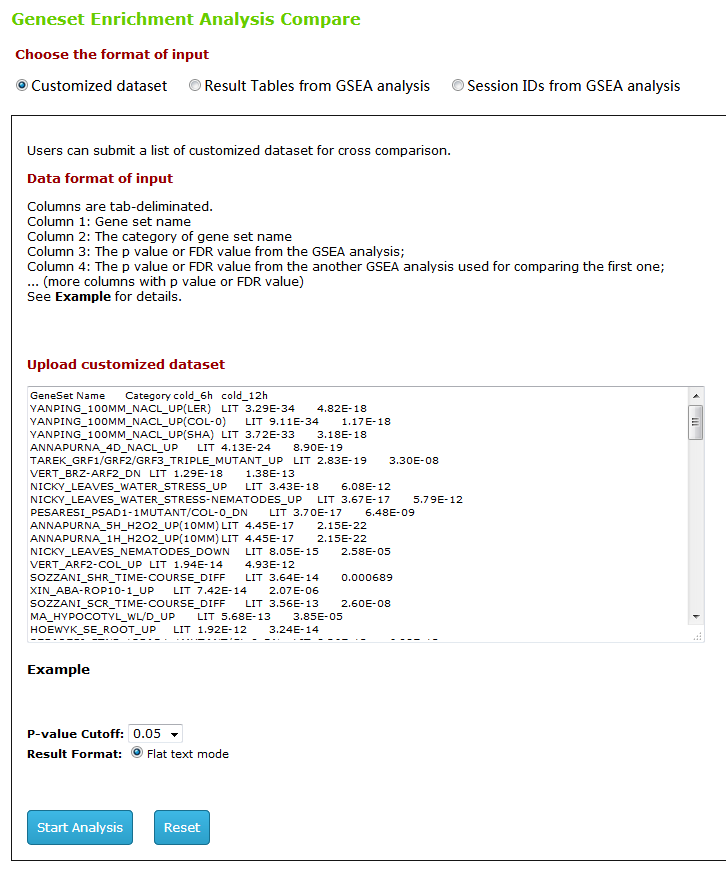
Type2
Type3
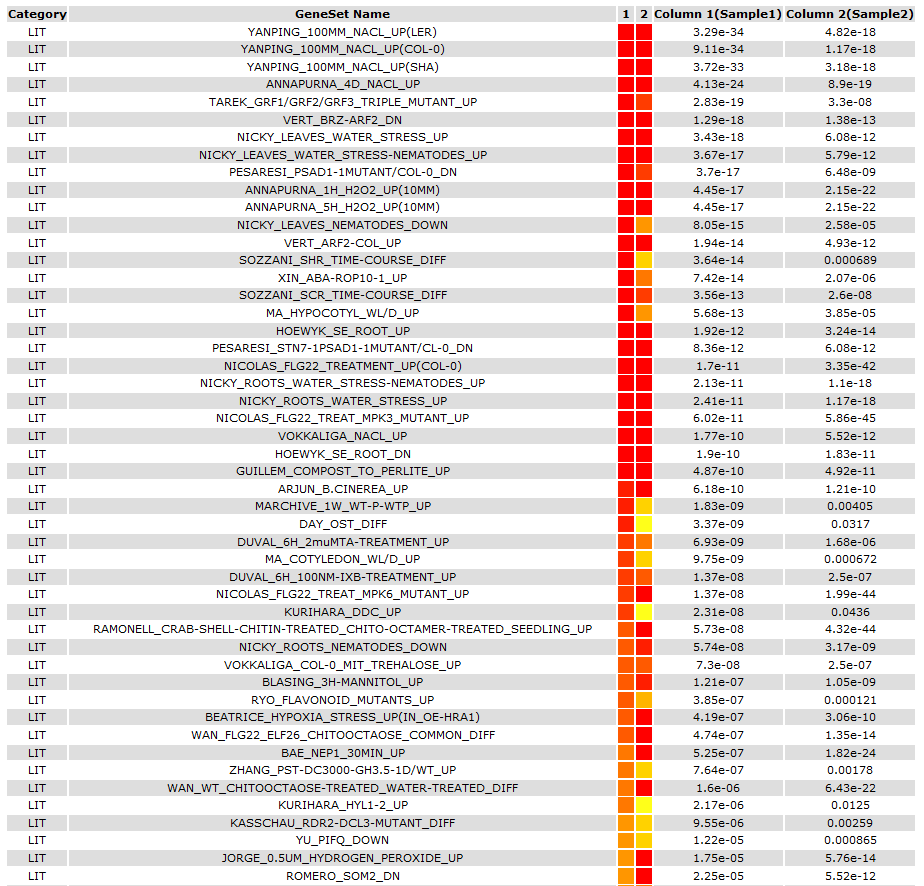
2nd : You can check out the result on page.
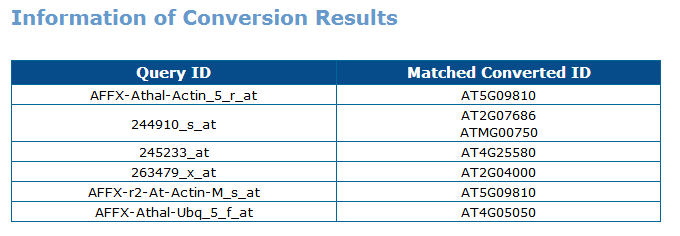
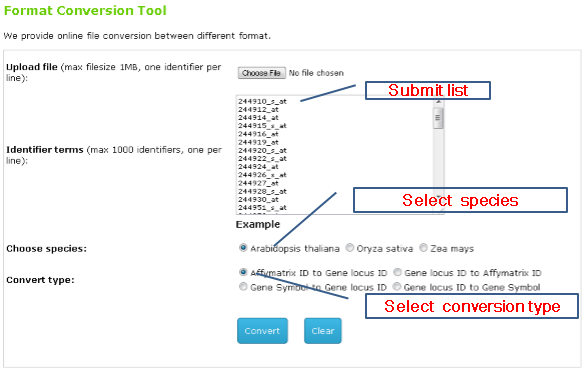
3.ID Conversion
You can either submit a list or a text file for conversion between gene locus ID and affymetrix probeset ID.
2nd : You can check out the conversion result on page.